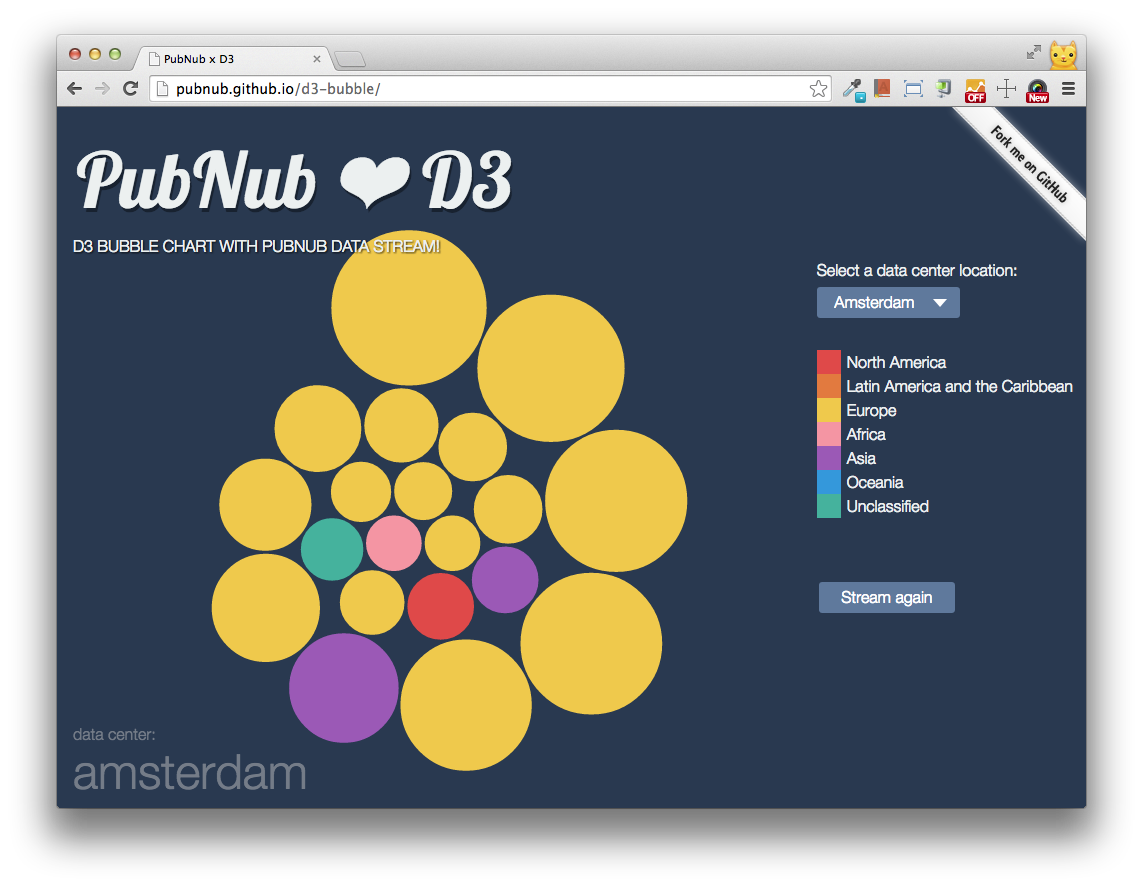
Data Visualization Eye Candy with Streaming JSON
Tomomi Imura
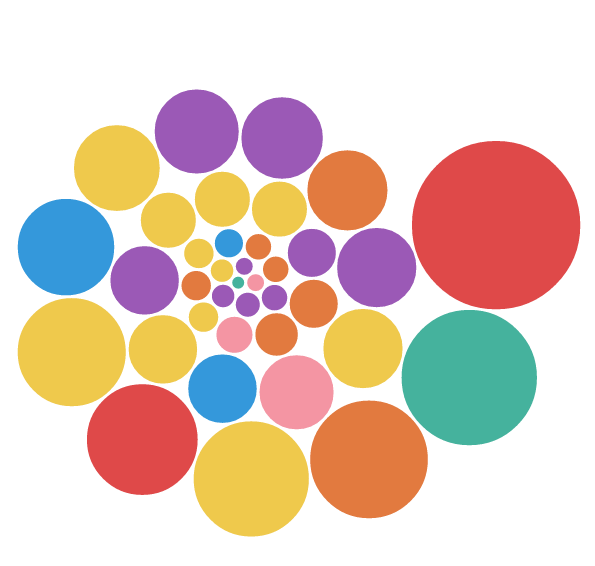
Create a pack layout with d3.layout.pack() object
var svg = d3.select('#chart').append('svg')
   .attr('width', 600).attr('height', 600);

var bubble = d3.layout.pack()
   .size([diameter, diameter])
   // new data will be loaded to bubble layout
   .value(function(d) {return d.size;})
var data = {"countries_msg_vol": {
   "CA": 170,
   "US": 393,
   "CU": 9,
   "BR": 89,
   "MX": 192,
   ...,
   "Other": 254
}};
{children: [an array of objects]}function processData(data) {
var obj = data.countries_msg_vol;
var newDataSet = [];
for(var prop in obj) {
newDataSet.push({name: prop,
className: prop.toLowerCase(), size: obj[prop]});
}
return {children: newDataSet};
}
.ca, .us {
	fill: #DF4949;
}
.uc, .br, .mx {
	fill: #E27A3F;
}
.other {
	fill: #45B29D;
}
...
Load the tailored data into the layout object's nodes() function
var nodes = bubble.nodes(processData(data))
   // filter out the outer bubble
   .filter(function(d) { return !d.children; });
Use the generated layout calculations to display in SVG
var g = svg.append('g');
var vis = svg.selectAll('circle')
   .data(nodes, function(d) { return d.name; });

vis.enter().append('circle')
   .attr('transform', function(d) { return 'translate('
      + d.x + ',' + d.y + ')'; })
   .attr('r', function(d) { return d.r; })
   .attr('class', function(d) { return d.className; });
<script src="//cdn.pubnub.com/pubnub.min.js"></script>var channel = 'my-data-channel'; var pubnub = PUBNUB.init({ subscribe_key: my_subscription_key_here });
To retrieve your data stream, use subscribe() API
pubnub.subscribe({
  channel: channel,
  callback: drawBubbles(message) {
  	// place the code from Step 1.3
  }
});
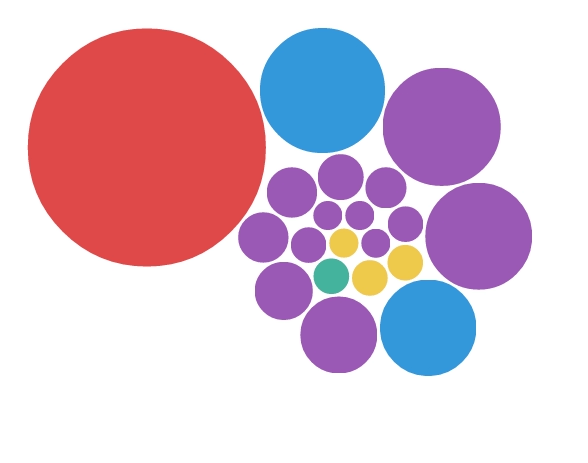
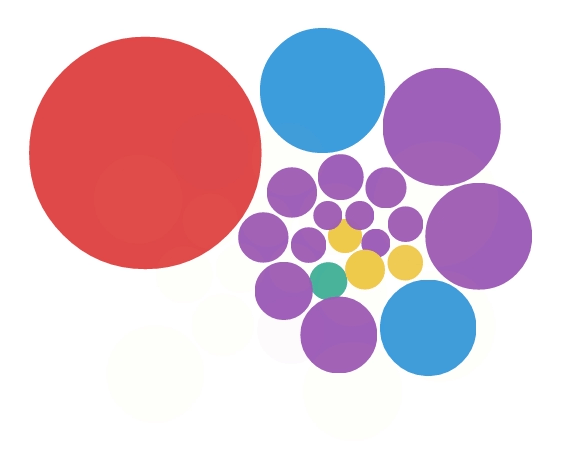
New set of data comes in, new bubbles are displayed on top

To make the node updateable, you need to assign a name to each node.
D3 takes a key function as a 2nd argument to the data():
var vis = svg.selectAll('circle')
   .data(nodes, function(d) { return d.name; });
To enter new data to the existing nodes, we are going to update them. This way, each assigned bubble circle updates its size and position correctly, instead of creating a new one with new data.
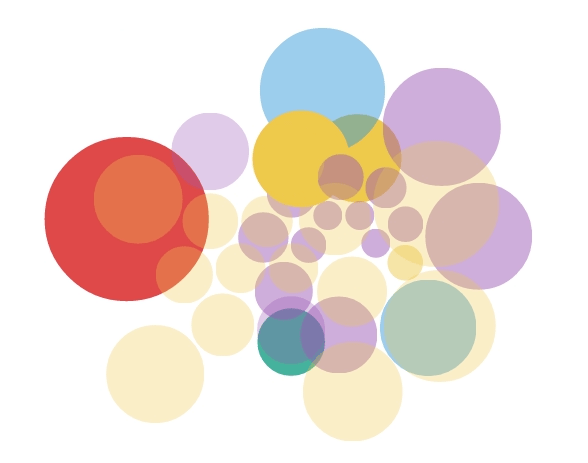
Create the transition on the updating elements before the entering elements
because enter().append() merges entering elements into the update selection
// update - This only applies to updating nodes
vis.transition()
  .duration(duration)
  .delay(function(d, i) {delay = i * 7; return delay;})
  .attr('transform', function(d) {
    return 'translate(' + d.x + ',' + d.y + ')'; })
  .attr('r', function(d) { return d.r; })
// enter
vis.enter().append('circle')
  .attr('transform', function(d) {
    return 'translate(' + d.x + ',' + d.y + ')'; })
  .attr('r', function(d) { return d.r; })
  .attr('class', function(d) { return d.className; })
  .style('opacity', 0)
  .transition()
  .duration(duration * 1.2)
// exit
vis.exit()
  .transition()
  .duration(duration + delay)
  .style('opacity', 0)
  .remove();